|
||||||||||||||||||||||||
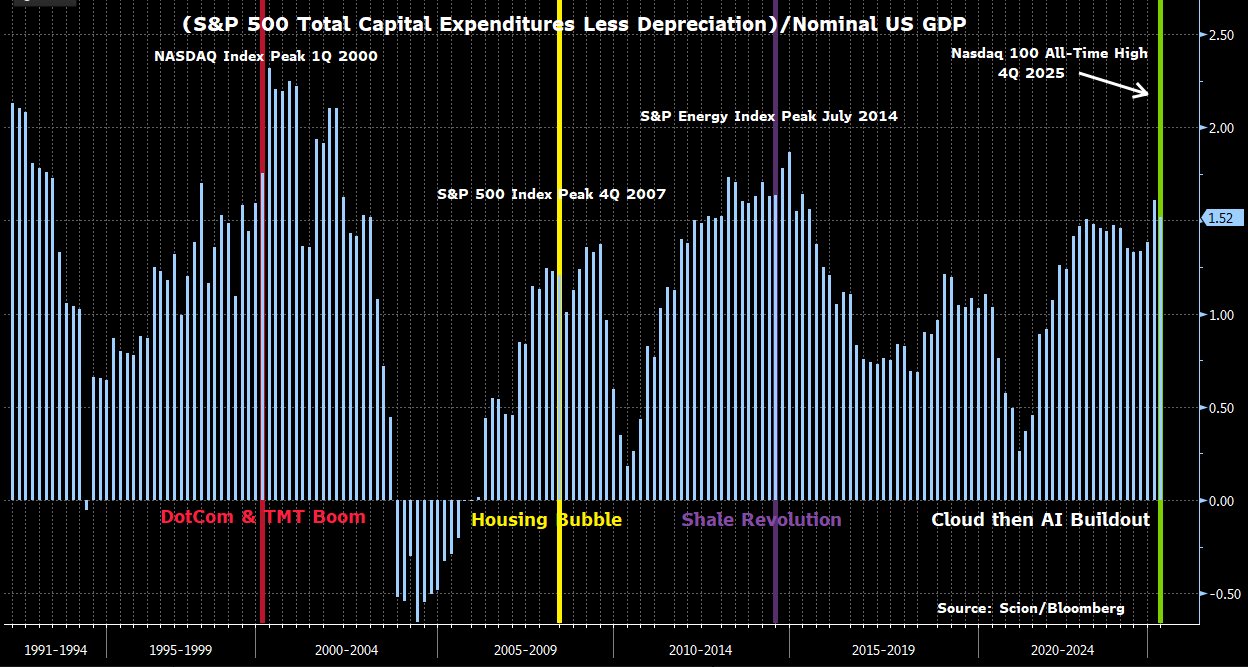
– The chart from Michael Burry, a renowned investor known for predicting the 2008 housing crash, shows S&P 500 capital expenditures minus depreciation as a percentage of U.S. GDP, highlighting periods of economic bubbles (e.g., Dot-Com, Housing) and a recent rise toward 2025, suggesting potential overinvestment or an AI-driven buildout, as noted in Mariner Wealth Advisors’ 2024 analysis of productivity growth tied to AI innovation.

– Historical data from Investopedia indicates that housing bubbles, like the 2007-2009 crash triggered by subprime lending and mortgage resets, led to a 19% price drop and over 2.8 million foreclosures annually, providing context for Burry’s warning that this single chart could “refute them all,” possibly challenging optimistic economic forecasts for late 2025.
– The “Three Yards and a Cloud of Dust” metaphor from Mariner’s 2024 report, inspired by a conservative football strategy, aligns with Burry’s cautious outlook, suggesting a low-risk but slow-growth economic scenario, while his cryptic “to be continued” hint on November 25th may signal an impending detailed critique based on emerging financial data.

WordPress’d from my personal iPhone, 650-283-8008, number that Steve Jobs texted me on
https://www.YouTube.com/watch?v=


 Duck9 is a credit score prep program that is like a Kaplan or Princeton Review test preparation service. We don't teach beating the SAT, but we do get you to a higher credit FICO score using secret methods that have gotten us on TV, Congress and newspaper articles. Say hi or check out some of our free resources before you pay for a thing. You can also text the CEO:


