|
||||||||||||||||||||||||
### Unprecedented Volatility: The Clustering of 6-Sigma Events in Global Markets and the Rise of “No Limit Gains”
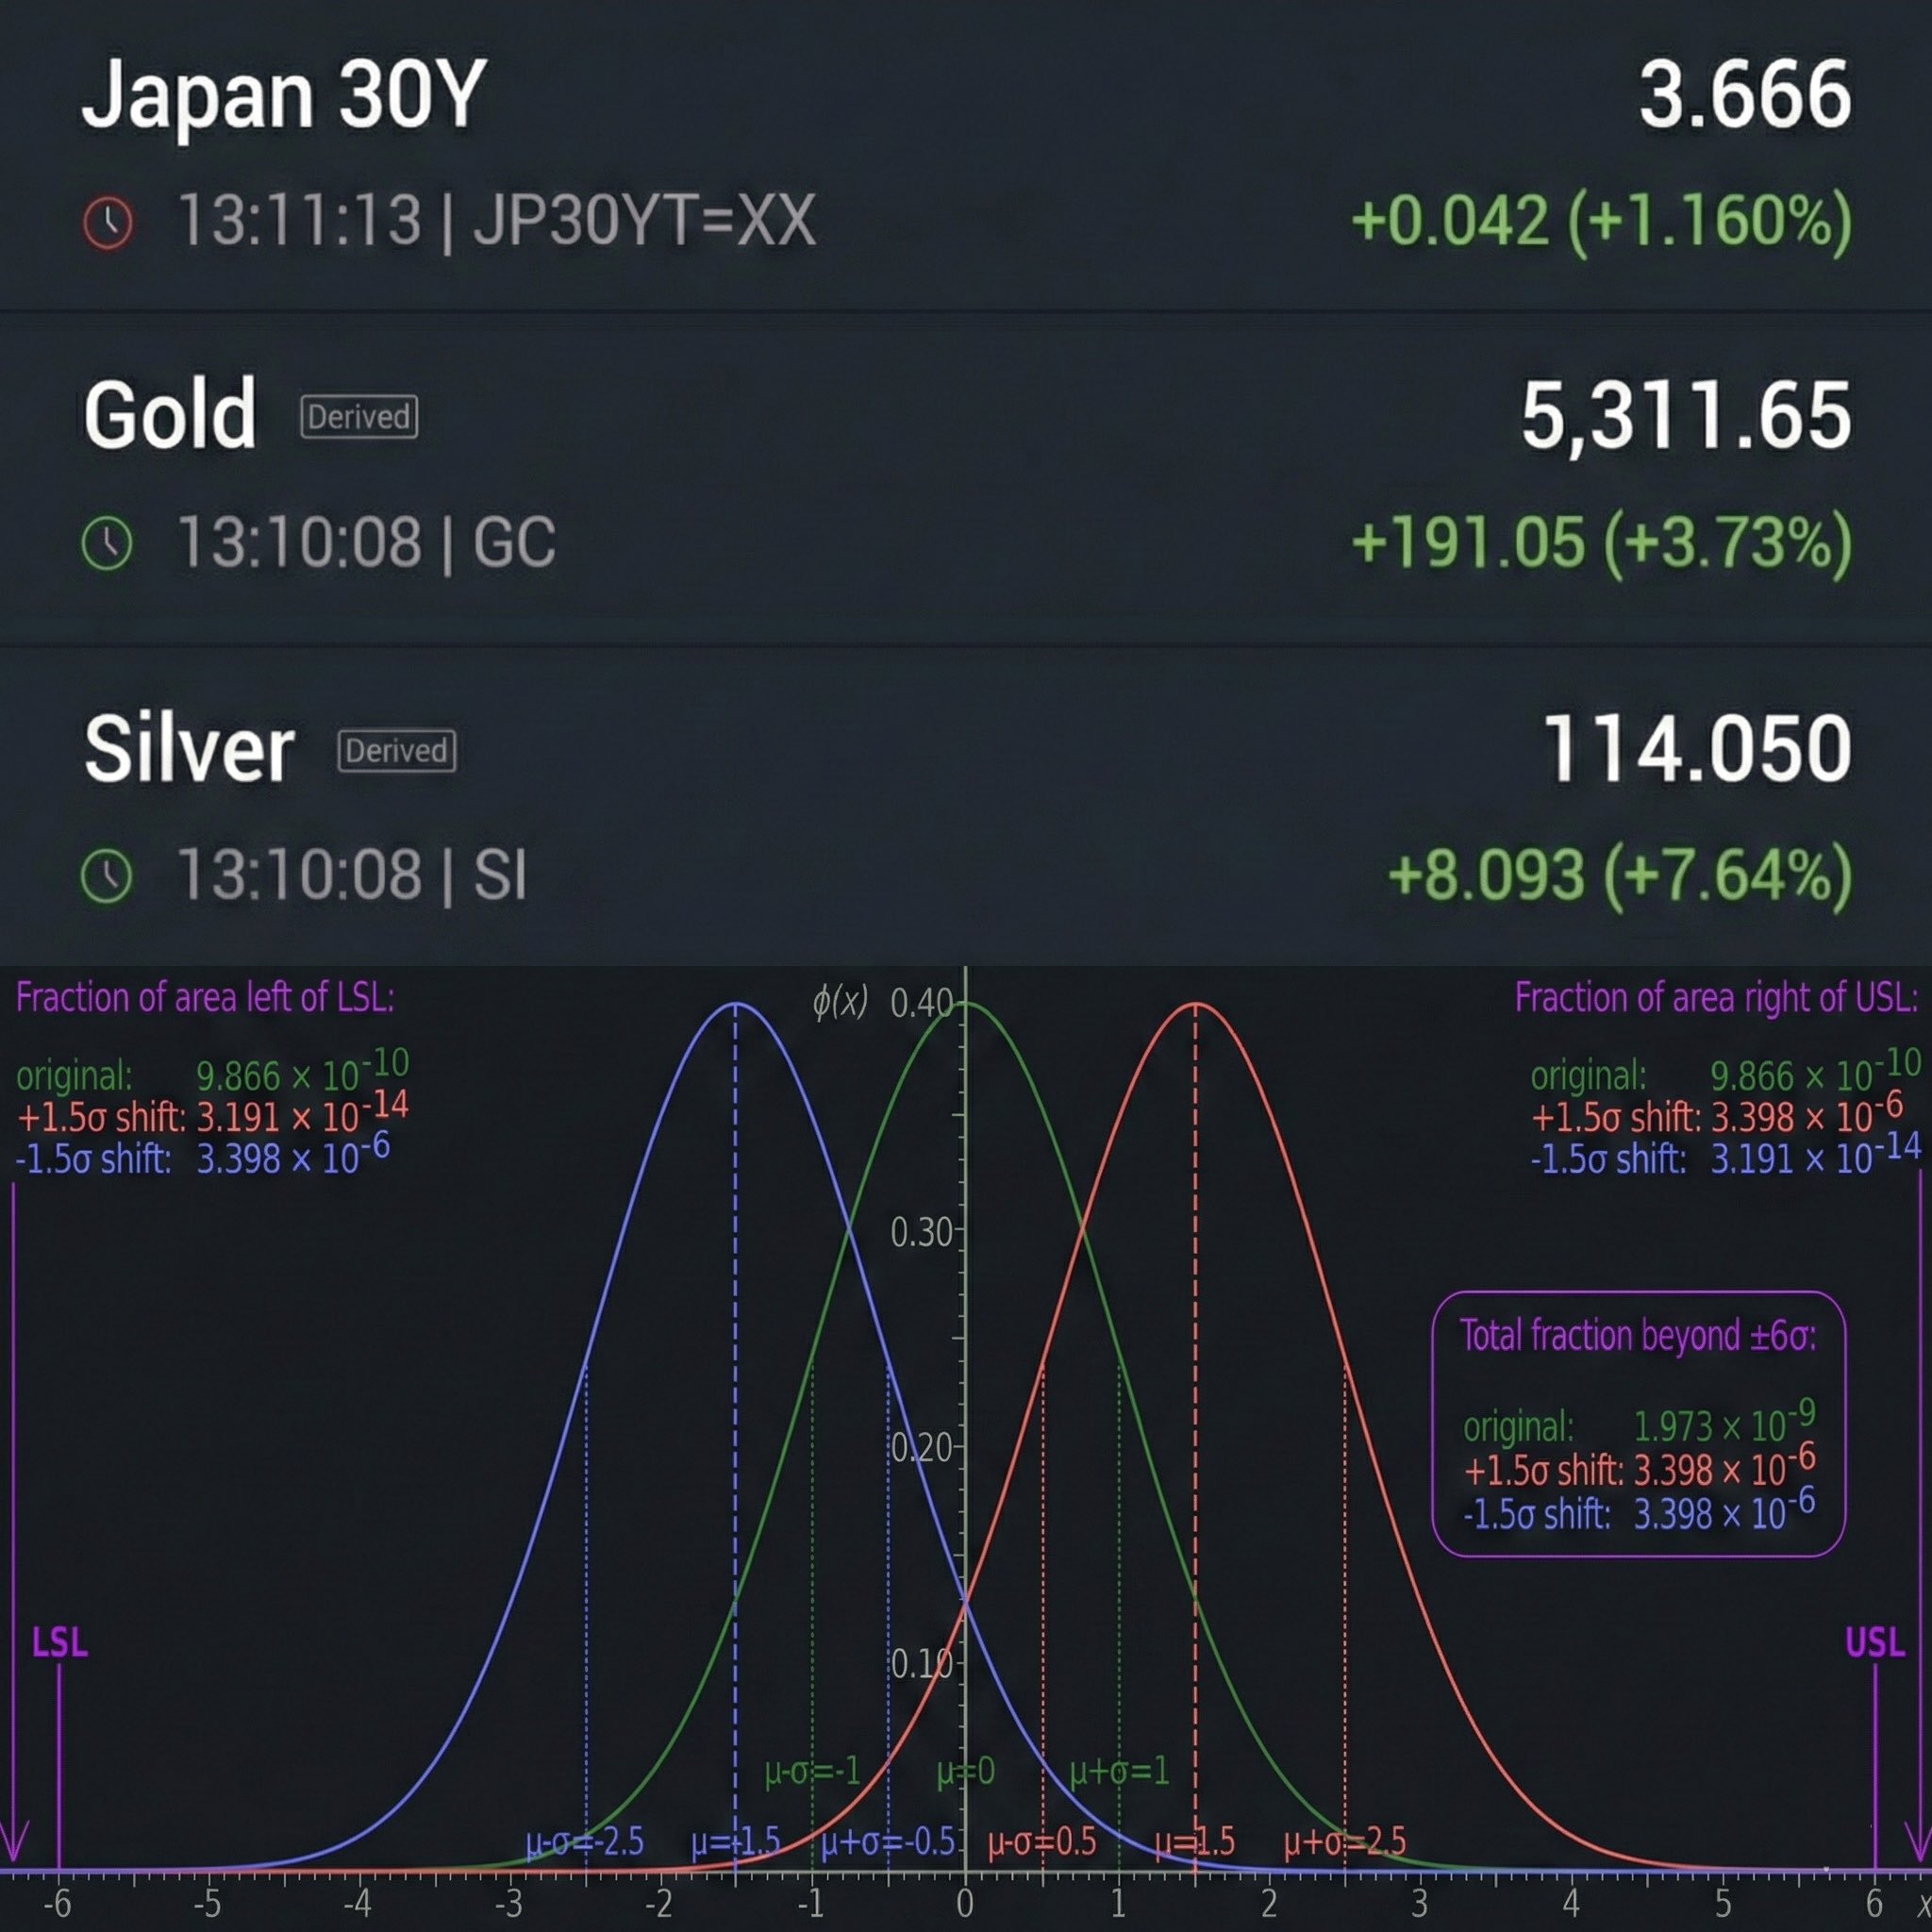
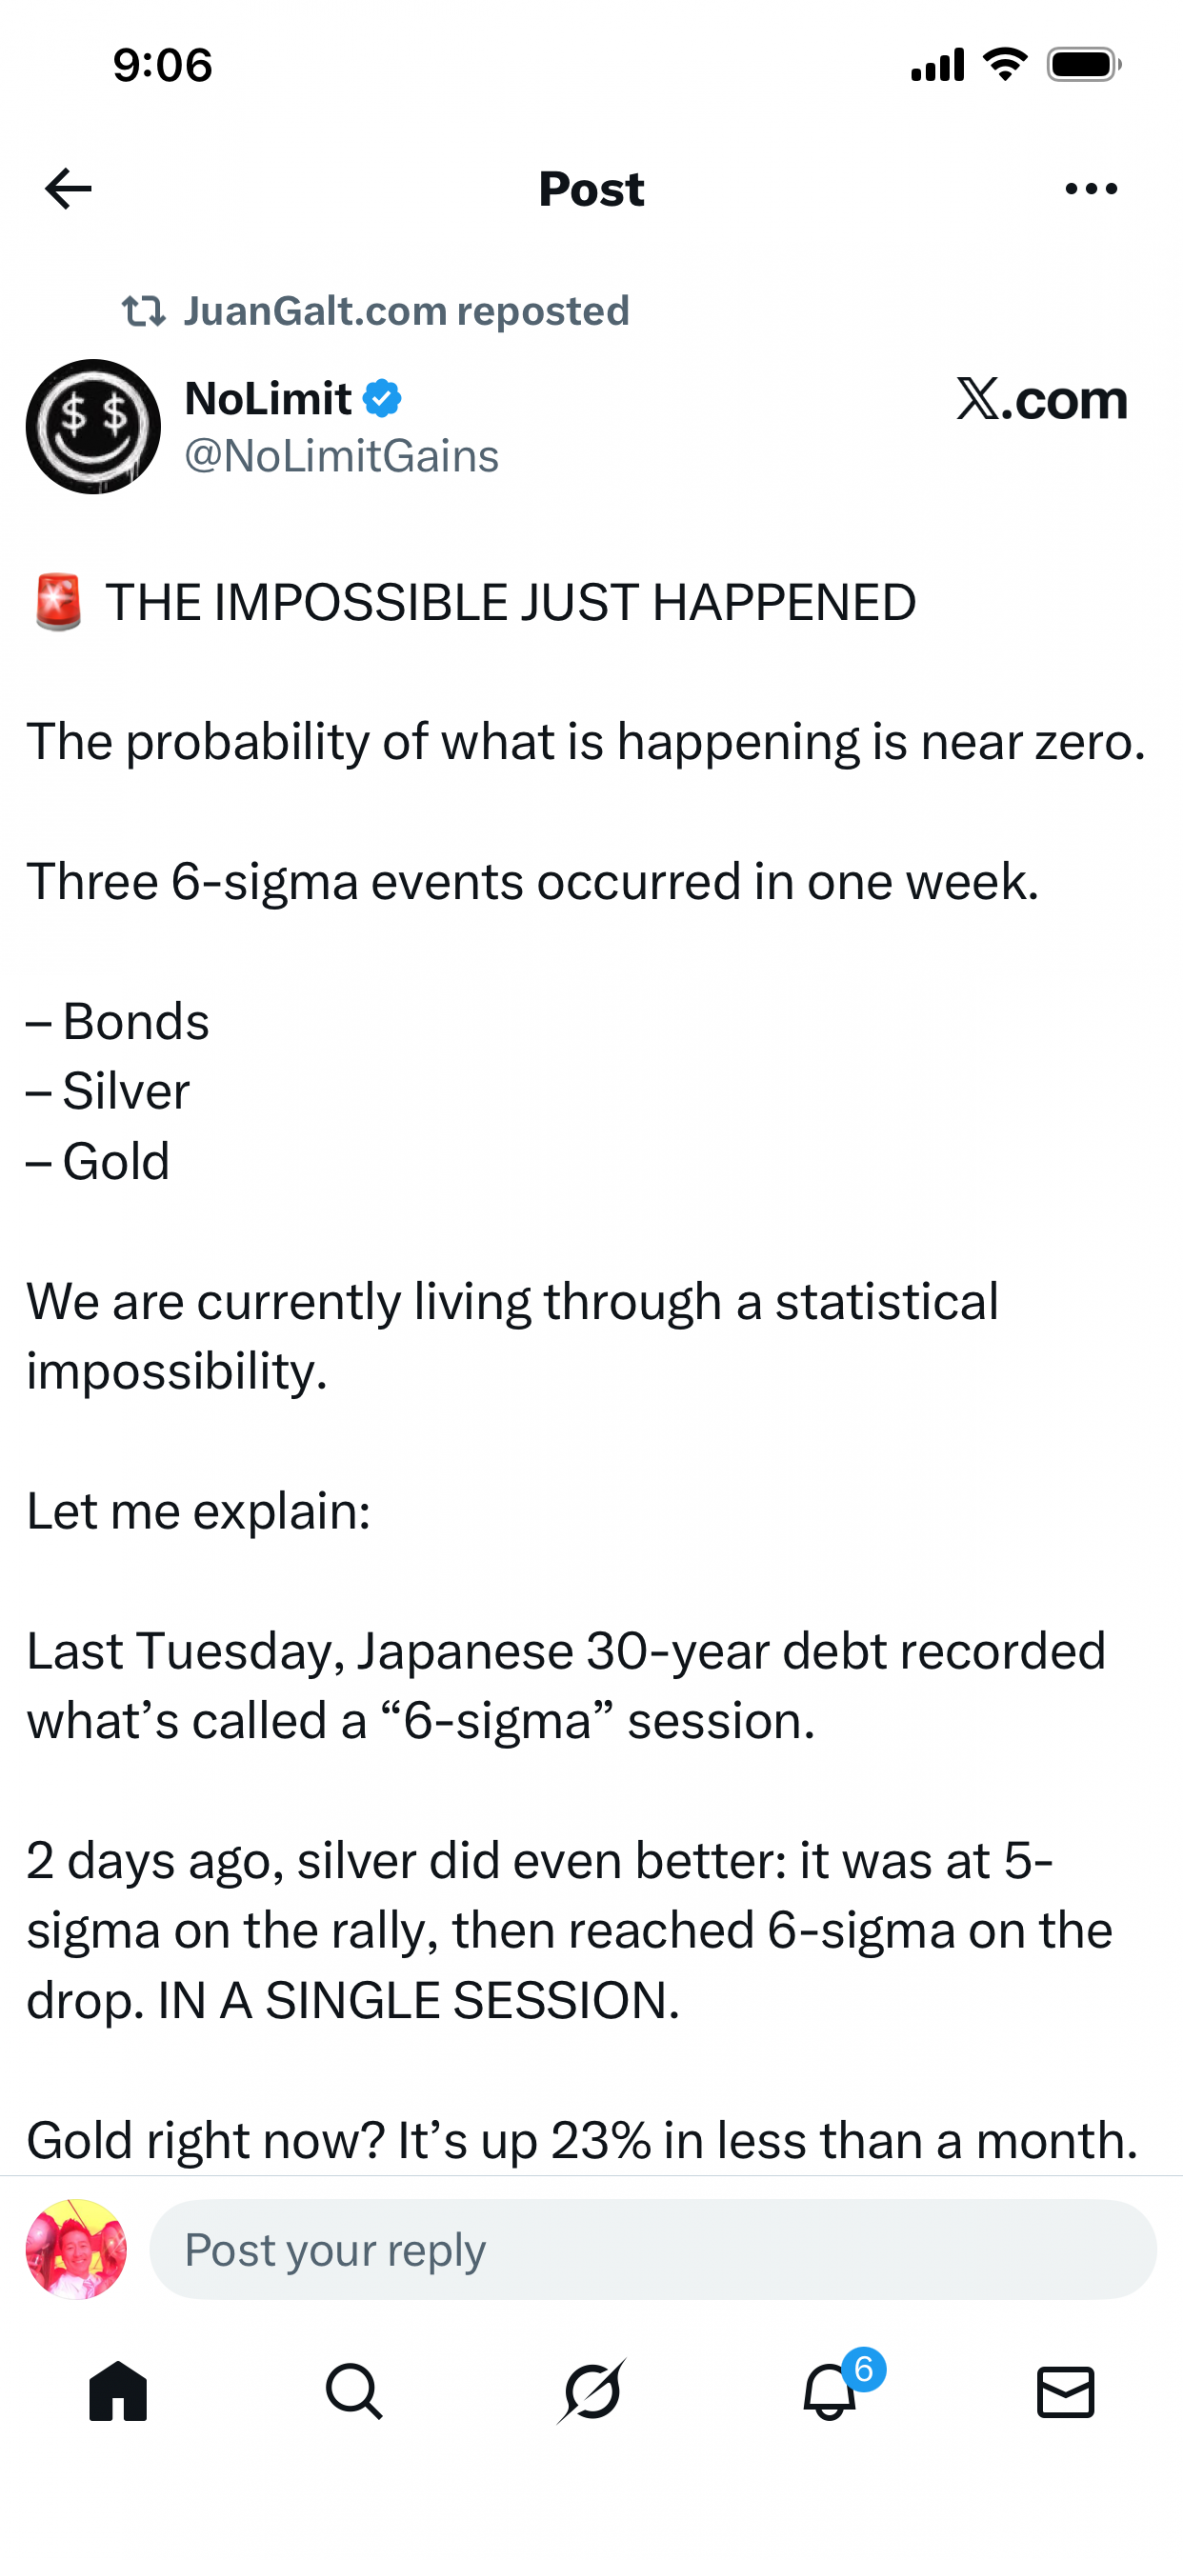
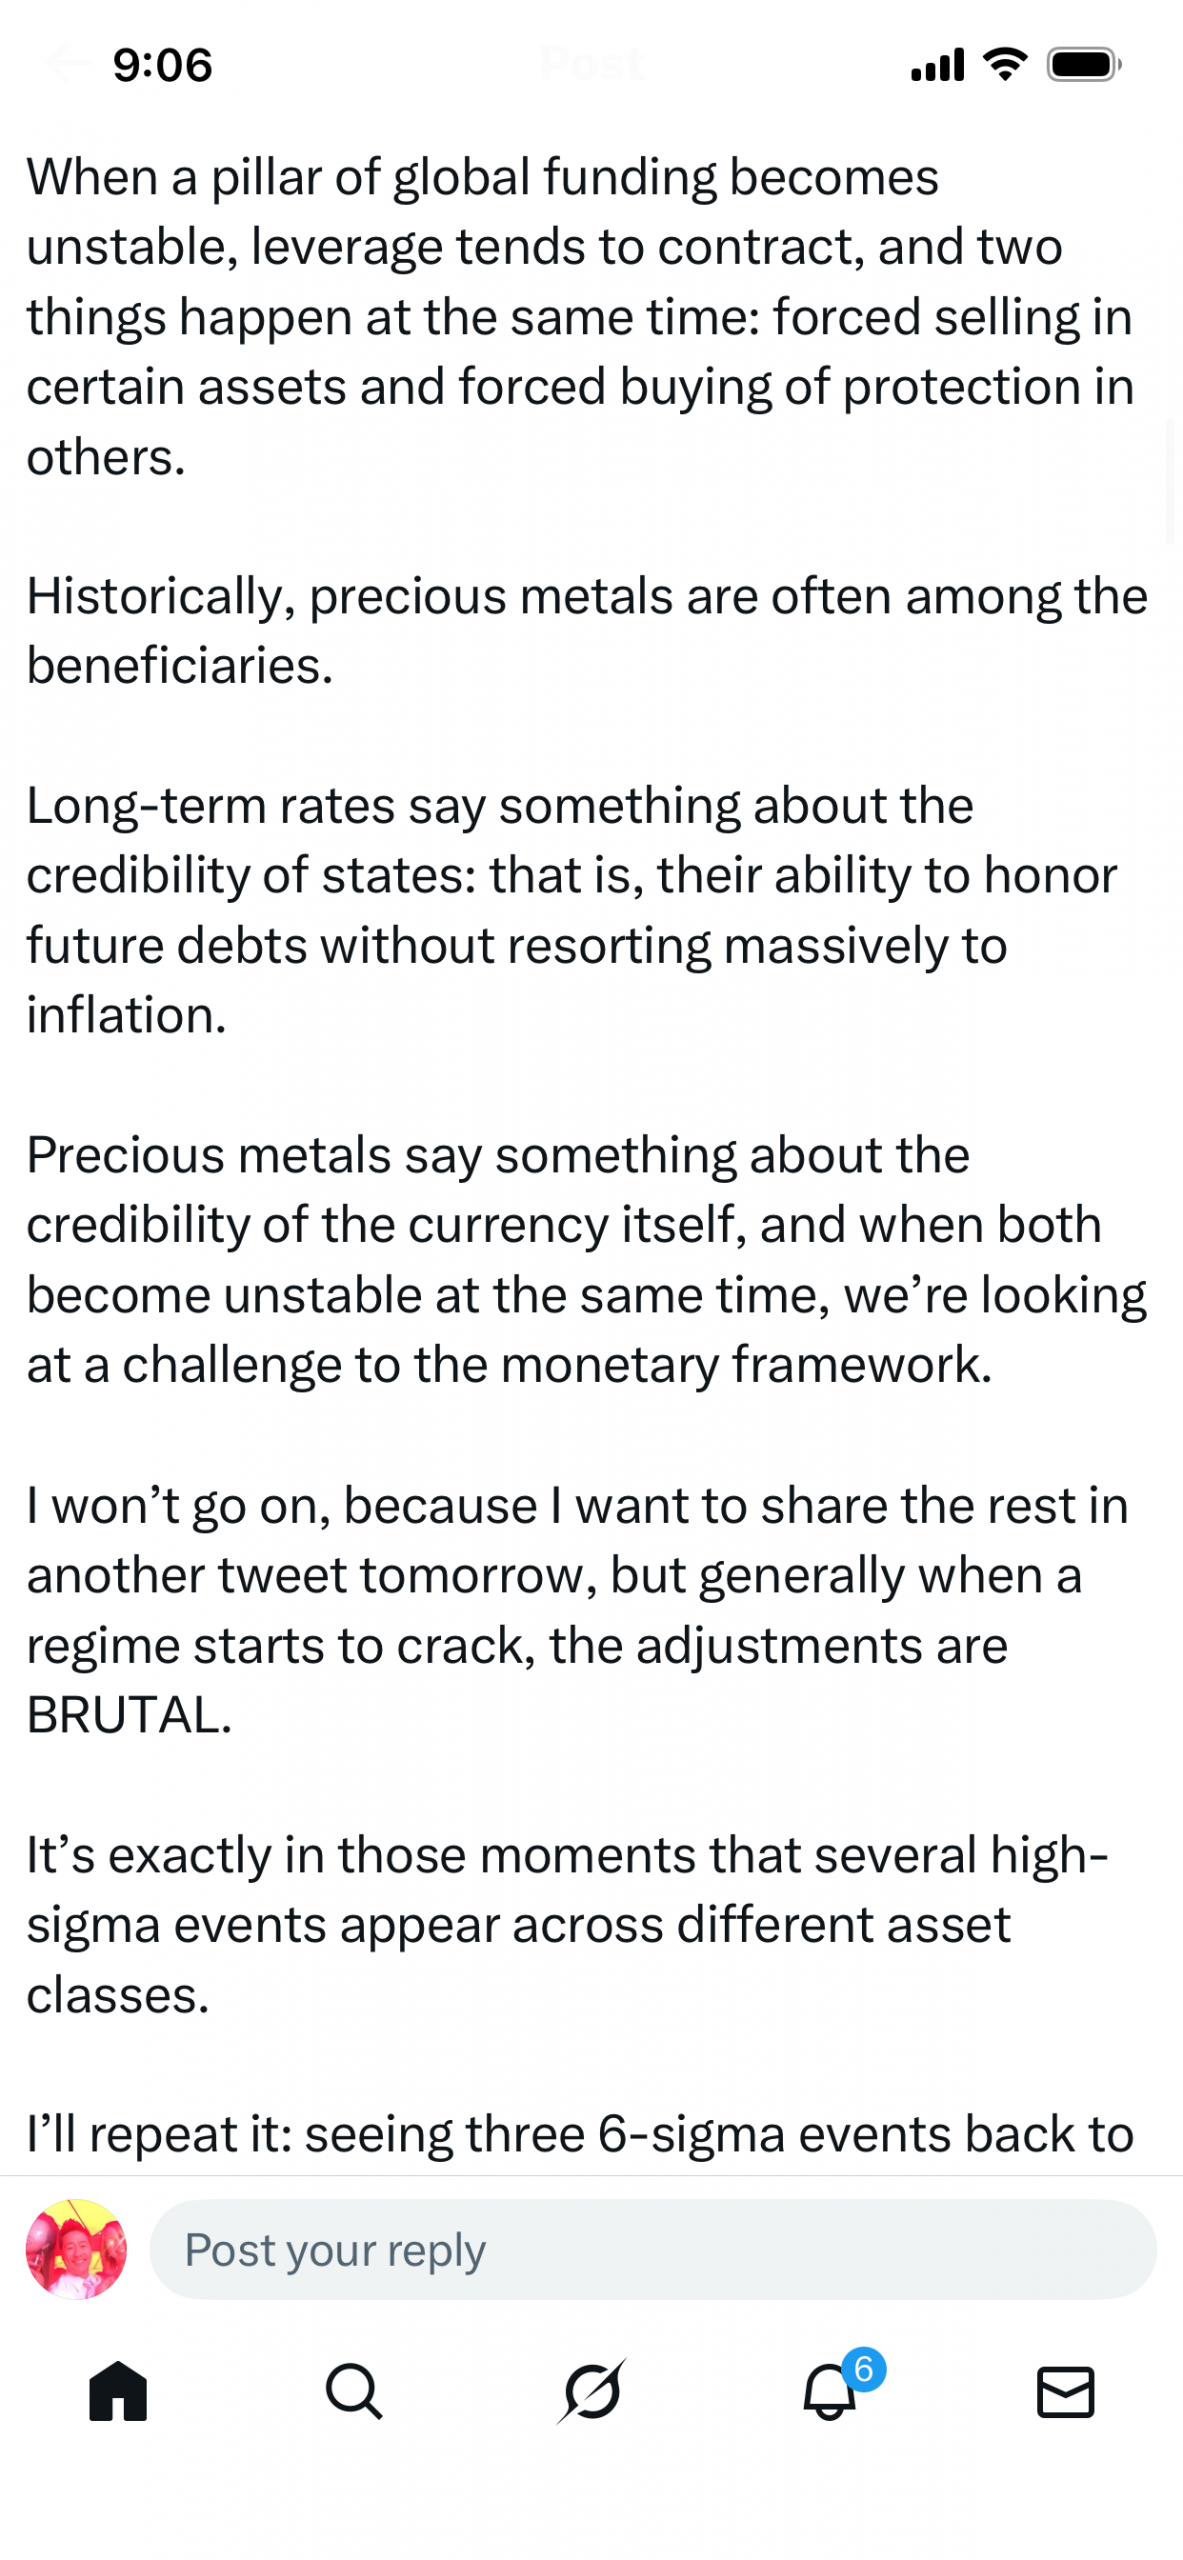
In late January 2026, a widely shared analysis on X (originally posted by @NoLimitGains and amplified through retweets) declared that “the impossible just happened” in global financial markets. It pointed to three extraordinarily rare 6-sigma events occurring within a single week across Japanese 30-year government bonds, silver, and gold. These deviations from historical norms were described as so improbable—each with odds approaching 1 in 500 million under standard statistical assumptions—that their clustering signaled deep systemic stress, potentially heralding a major shift in the financial order.
The post framed this as evidence of accelerating “no limit gains” in precious metals as traditional fiat and bond markets faced unprecedented pressure. This narrative resonated amid broader economic uncertainties, including geopolitical tensions and policy shifts.
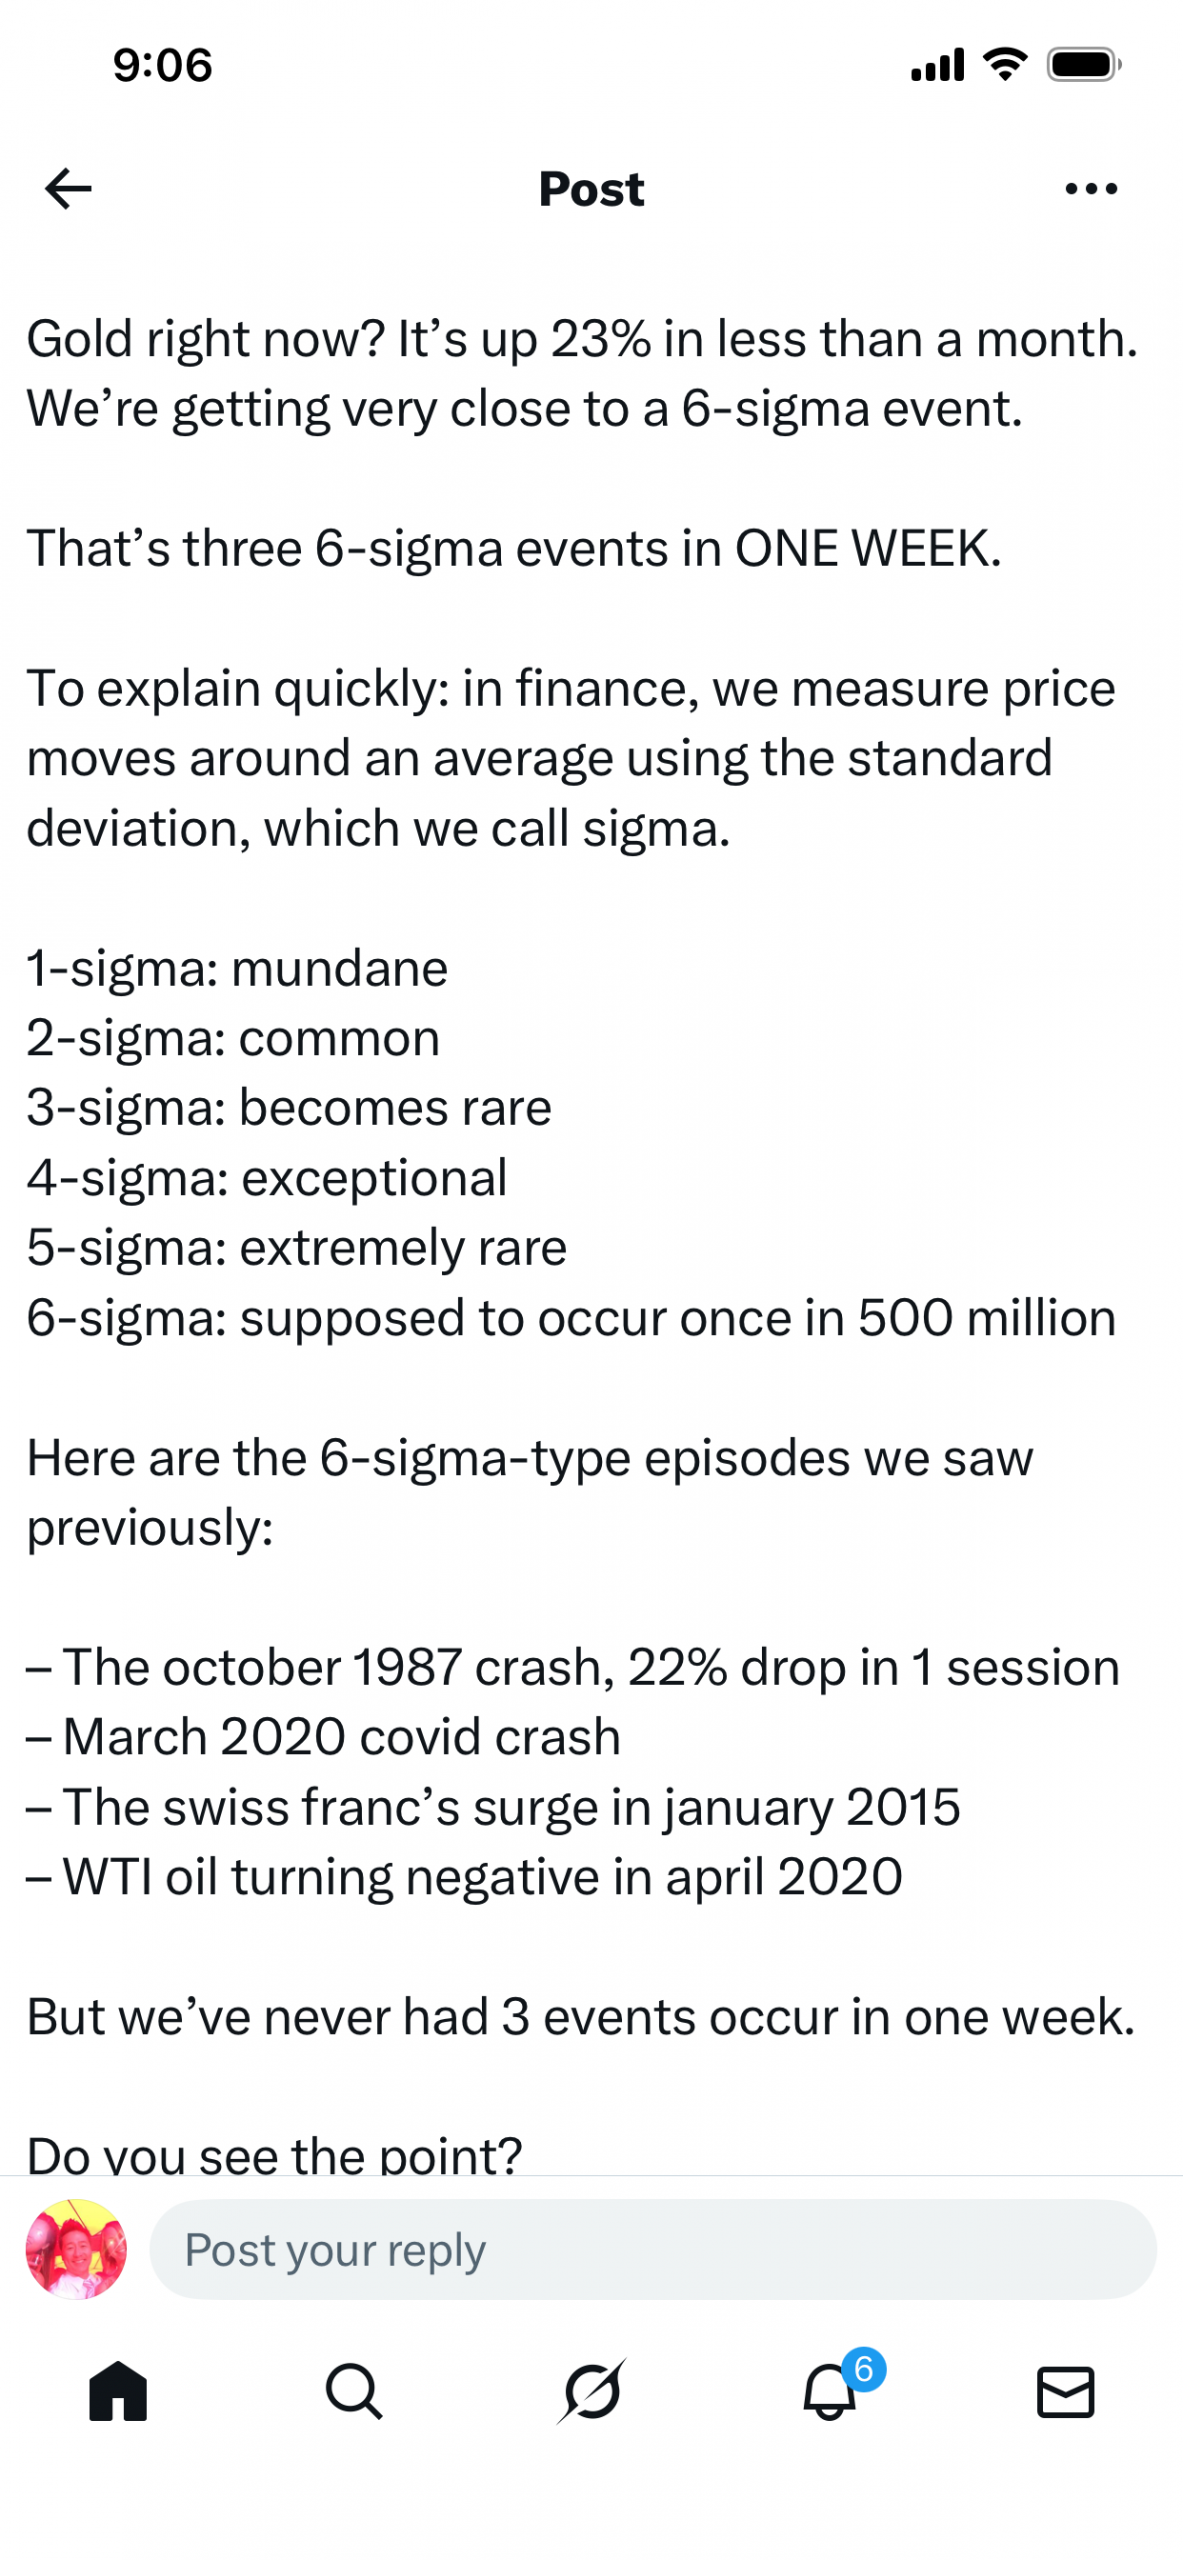
A 6-sigma event refers to a price move or volatility spike six standard deviations from the mean in a normal distribution, an occurrence theoretically expected once every several hundred million years in stable conditions. Financial markets, however, exhibit “fat tails,” where extreme events cluster more often during crises than Gaussian models predict.
Historical parallels include the 1987 Black Monday crash (a roughly 20-sigma event in equities), the 2008 financial crisis (multiple 10+ sigma moves), and the 2020 COVID turmoil (rapid high-sigma deviations amid liquidity freezes). When such outliers converge in short order, they often precede broader dislocations, as leverage unwinds, margin calls cascade, and confidence erodes.
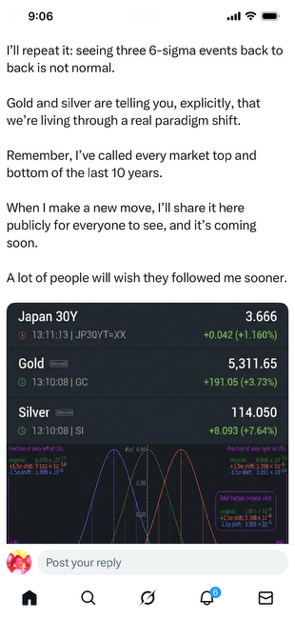
The first event centered on Japan’s ultra-long government bonds. On January 20, 2026, the 30-year Japanese Government Bond (JGB) yield surged approximately 30 basis points in a single session and 42 basis points over two days, reaching 3.91%—the highest level since the 30-year benchmark was introduced in 1999 (Wolf Street, January 20, 2026; Bloomberg, January 25, 2026).
This violent selloff followed Prime Minister Sanae Takaichi’s push for aggressive fiscal stimulus, including tax cuts and increased spending, amid snap elections to secure parliamentary support. The move was described in market commentary as a classic “bond vigilante” reaction, punishing perceived fiscal recklessness in a nation with the world’s highest public debt-to-GDP ratio.
The spike exceeded the average daily trading range by roughly eight times over recent years, qualifying it as a multi-sigma outlier in volatility terms (Trading Economics data showed the yield peaking near 3.89% before easing slightly to around 3.63% by January 29, 2026). This shock rippled outward, pressuring global sovereign yields and contributing to carry-trade unwinds that had relied on cheap Japanese funding.
Analysts noted the event’s rarity, with some calling it a statistical anomaly that “shouldn’t happen” under normal conditions (YouTube market analysis referencing the yield explosion as a 6-sigma move). The chart below illustrates the yield’s sharp rise in January 2026:
“`
Japanese 30-Year Bond Yield – January 2026
*
*
*
*
*
*
** ***
** * *
* ** *
*
* *
*
**** ****
* ****** *
* * *
**** *
01-01 01-01 01-01 01-01 01-01
Min: 3.40 Max: 3.85
“`
The second event unfolded in silver markets on January 26, 2026. Spot silver prices surged as much as 14% intraday, briefly topping $117 per ounce before closing with a modest net gain of about 0.6% (Bloomberg, January 25, 2026; Mexico Business News, January 28, 2026).
This marked the metal’s largest single-day move since 2008 and propelled it to multiple record highs amid a broader January rally exceeding 50% (Economic Times, January 27, 2026). Drivers included intense physical demand (particularly from China), supply tightness leading to COMEX inventory draws, speculative short squeezes, and silver’s dual role as an industrial metal (used in solar, electronics, and EVs) and inflation/geopolitical hedge.
The intraday volatility and deviation from norms positioned this as a 5- to 6-sigma event in trading commentary, amplifying fears of derivative market fragility where leveraged positions can fuel explosive swings. The chart below shows silver’s volatile path through January 2026:
“`
Silver Price – January 2026
*
*
* *
* * *
* *
* *
* *
** *
* * *
*** ****** *
* * *
*
*
*
*******
**
*
*
01-01 01-01 01-01
Min: 71.02 Max: 119.36
“`
The third pillar was gold’s breakthrough above $5,000 per ounce. Spot gold climbed to over $5,100 (peaking near $5,111) around January 25–26, 2026, before stabilizing in the mid-$5,000s (Reuters, January 25, 2026; CNBC, January 26, 2026; The Guardian, January 26, 2026).
This followed a 23%+ monthly gain and built on 2025’s roughly 65% advance. Key catalysts included central bank purchases, ETF inflows, safe-haven flows amid U.S. policy uncertainty under President Trump (tariffs, ally frictions), Middle East tensions, and doubts about fiat stability.
Forecasts quickly adjusted upward, with targets ranging from $5,400–$6,400 by year-end and some logarithmic cycle models suggesting potential for $8,000–$9,000 if patterns from the 1970s inflation era repeat (GoldSilver analysis; Goldman Sachs and Bank of America notes referenced in CNN Business and WSJ coverage). The chart below depicts gold’s steady climb in January 2026:
“`
Gold Price – January 2026
*
*
*
****
*
* **
**
*** *
*
*
****
**********
*
*********
*
***
01-01 01-01 01-01 01-01 01-01
Min: 4329.60 Max: 5562.50
“`
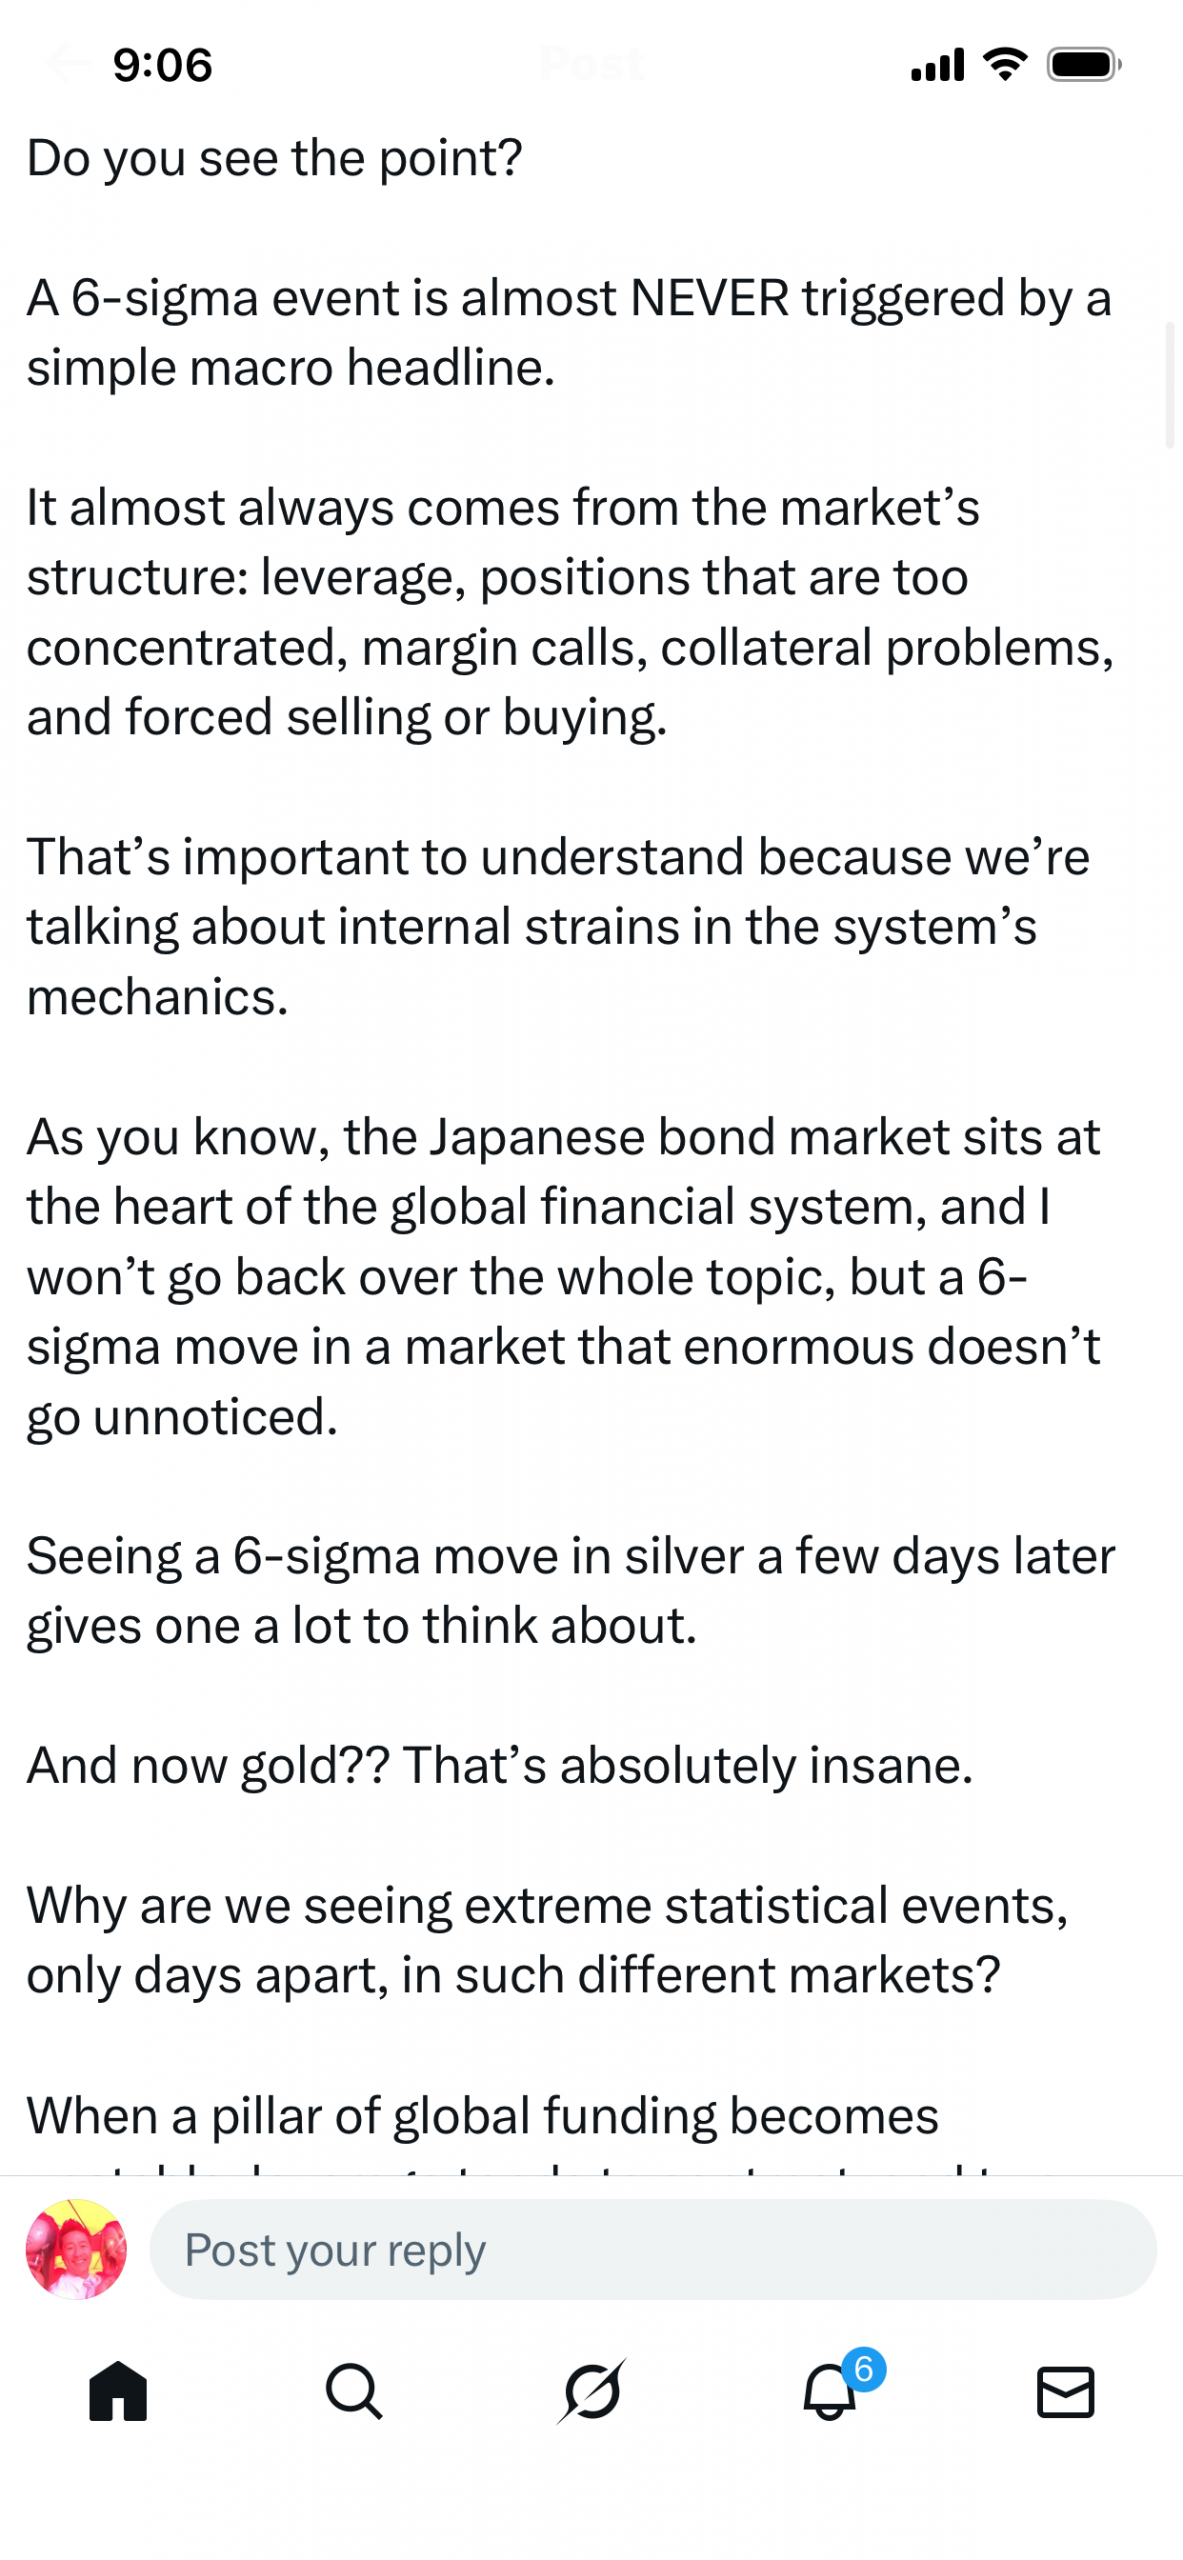
The convergence of these three events in one week fueled the X post’s dramatic claim of a “statistical impossibility.” Market observers on platforms like X, forums, and analyses echoed this, describing it as three black swans or a sign of fracture in the global system (Peak Prosperity summary; Greater Fool blog, January 28, 2026; various X reposts attributing to @NoLimitGains).
While some countered that fat-tailed distributions make such clusters more plausible during stress, the timing aligned with broader concerns: geoeconomic fragmentation, elevated global debt, nonbank leverage, and policy shocks.
For investors, this episode highlights the “no limit gains” narrative in precious metals. Gold and silver have acted as hedges against eroding fiat credibility, bond instability, and volatility. Silver’s outperformance reflects structural supply-demand imbalances, while gold benefits from institutional and central bank demand.
Risks remain—sharp corrections could follow if real yields rise sharply or if geopolitical tensions ease—but the medium-term outlook favors upside as traditional anchors like Japanese bonds wobble.
In this environment of managed disorder and subdued global growth forecasts, the January 2026 anomalies serve as a stark reminder: markets can defy probability when underlying pressures build. Diversification into tangible assets, vigilance against leverage, and awareness of tail risks have rarely felt more relevant.

 Duck9 is a credit score prep program that is like a Kaplan or Princeton Review test preparation service. We don't teach beating the SAT, but we do get you to a higher credit FICO score using secret methods that have gotten us on TV, Congress and newspaper articles. Say hi or check out some of our free resources before you pay for a thing. You can also text the CEO: